
GWA Group Ltd
GWA Group Limited is an Australia-based company.
The business
GWA Group Limited is an Australia-based company. The Company is engaged in research, designing, importing and marketing building fixtures and fittings for residential and commercial premises, including sanitaryware, tapware and showers, baths, intelligent water management solutions, and related kitchen, bathroom and laundry products/accessories. It distributes, installs, maintains and repairs various products through a range of distribution and customer channels in Australia, New Zealand and selected international markets. It is also engaged in Water Solutions, which includes the sale of vitreous China toilet suites, basins, plastic cisterns, taps and showers, baths, kitchen sinks, laundry tubs, domestic water control valves, smart products and bathroom accessories. Its brands include Caroma, Methven, Clark and Dorf. Its subsidiaries include Caroma Holdings Limited, Caroma Industries Limited, Caroma International Pty Ltd, Caroma Singapore Pte Ltd, Deva Tap Company Ltd and others.
Small Caps Research
No research on GWA Group Ltd yet
We cover the ASX small-cap market one company at a time. Request coverage and we’ll prioritise GWA based on demand.
Share price
Market Statistics
Valuation
Trading Activity
Performance
Latest news
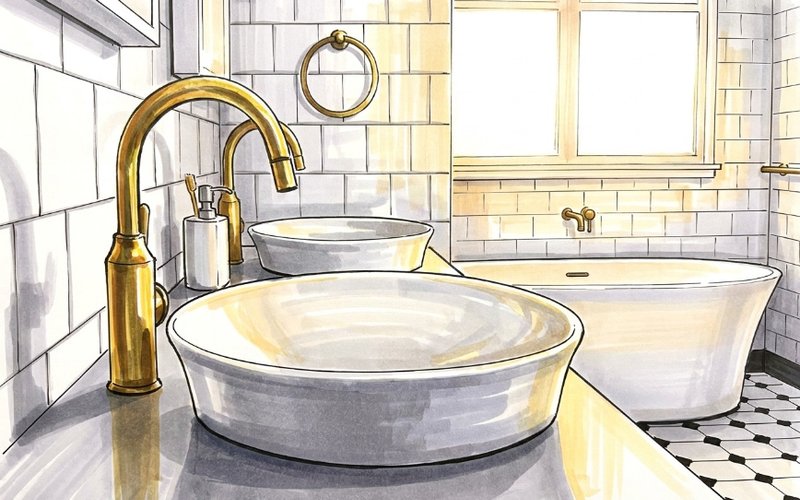
GWA Group Lifts Profit and Dividend as Volumes Offset Soft Markets
GWA Group lifts FY26 NPAT 10.6% to $48m as volumes rise; final dividend 8.5c, full-year 16.5c, despite softer markets; FY27 outlook mixed.

From Gold to Green Steel: We dive into TBR, GRR, JMS and More
The Australian share market has turned cautious again. Volatility has returned, sentiment has softened and many investors are stepping back. We see it differently.
Looking for charts & signals? See the tab.
Unlock the full research library - free.
Create a free account to access every broker report, CEO interview, IPO alert, and daily market wrap. No credit card. No paywall.