Does the inverted yield curve mean a US recession is coming?

An inverted yield curve has predicted the past 7 recessions in the United States.
If you believe what world share markets are telling you at the moment, a US recession is just around the corner and could also be experienced in Europe, Japan and many other countries.
The reason cited is what is technically called an inverted yield curve.
What that means is that longer-term 10-year interest rates in the US are now lower than three-month rates.
A consensus of bond market traders through many thousands of transactions have now concluded that future interest rates will be lower, which means they think that the US Federal Reserve will be forced to cut rates to stimulate economic activity in the near future.
The inverted yield trigger has been highly accurate in predicting the past seven recessions in the US, although the measure is not nearly as accurate for Australia.

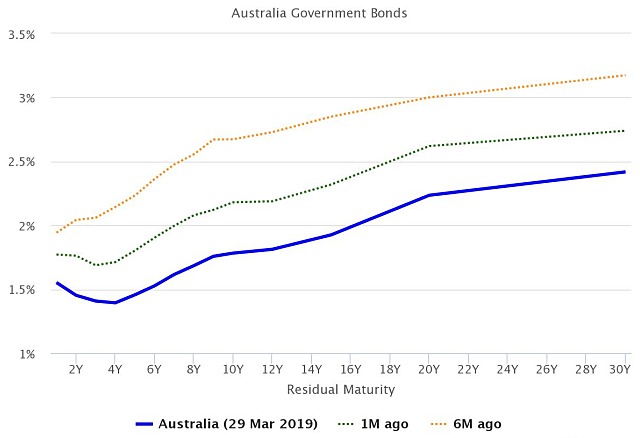
In fact, Australian three-month bank bill yields are now sitting above 10-year Australian Government bond yields – our own version of the inverted yield curve.
This is not uncommon in Australia with the yield curve inverting six times since the GFC, although obviously no recession has yet emerged from these previous inversions.
Could the yield curve be telling us something new?
Certainly, US markets are big believers in the predictive power of the inverted yield curve, falling sharply by 1.9% when the most closely watched and significant part of the yield curve inverted late last week.
Without appearing to be too desperate for justifications as to why the current expansion should not continue, there are some reasons to believe that the inverted yield curve may not be as strong a predictor of the future as it used to be.
One is the very reason why the Australian yield curve has not been accurate – basically our 10-year bond rates are much more strongly correlated with what is happening to US 10-year bonds than what is happening to shorter term Australian bond rates.

So, when you compare what is happening to an internationally dependent rate (the 10-year) compared to a domestically dependent rate (three-month bank bills or bonds, you can get a misleading inversion picture.
To some extent that might also be happening in the US now – its longer-term bonds may actually be moving lower due to much stronger connections between countries within the global economy.
So, with European and some other long-term bonds heading lower, US long term bonds might be heading down in sympathy despite more robust growth within the US.
Some brokers say buy the curve
Some US brokers are certainly in that camp, although that brings with it the caveat that brokers are always finding reasons to sell you some shares.
Some research by RBC Capital Markets chief US economist Tom Porcelli found that “yields have decoupled from growth in a very material way,” with 10-year Treasury yields at 2.50% very different to nominal economic growth of about 5%.
Last time nominal growth was that strong in 2006, 10-year yields were about 4.50%.
“What this means is the US is able to finance relatively good rates of growth at artificially suppressed interest rates. So, no, we are not on recession watch because of this dynamic. We are, more than any other point this cycle, on bubble watch.”
Other brokers have pointed out that US stocks have recorded very solid rises ranging from 15 to almost 60% during periods in which the yield curve has inverted.
So even if a US recession is coming down the pike in the next couple of years, that is not in itself a good reason to sell-off US shares.
Indeed, if they are right it might be the perfect dip to buy into.
Lower rates could boost stocks again
That makes some logical sense as well.
If the US Fed is forced to cut interest rates to keep economic growth going, that could be very positive for shares rather than being a good reason to sell.
As I pointed out in the last story on this topic, it is also important not to over-interpret the yield curve.
Just because an inverted yield curve has been very accurate at predicting US recessions in the past does not mean that it will be this time.
Economic data is actually “live” and brings with it a set of reactions that can change the picture quite quickly.
A great example is a very recent one.
When the US yield curve started to flatten and partly invert late last year, the US Fed had widely signalled that it was set to increase interest rates up to three times in 2019.
Fast forward a few months and now the Fed is effectively “on hold’’ for this year, which in itself is a significant cut in interest rate expectations.
So, the message that the beginnings of the inverted yield curve have already significantly changed behaviour in a feedback loop that can have some very big impacts on the event being predicted – in this case, the potential for a US recession.
There is no crystal ball
It would be great if share and other markets moved in predictable patterns that were easy to read and interpret but that simply doesn’t happen.
While the words “it is different this time’’ are famously used as a final excuse once a share market rally has become totally unreasonable, they can also be true at times when economies change and become more connected.
The inverted yield curve in the US may signal a coming recession or it may not – the only certainty for those seeking to profit from short term moves on markets is that constant vigilance and monitoring is needed and it doesn’t pay to become too attached to any particular theory.
