Behind the red light indicator that is predicting a recession

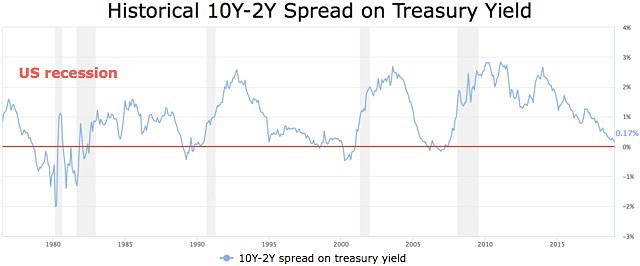
An inverted yield curve has predicted the past 7 recessions.
There has been plenty of talk lately about an inverted yield curve in the US which is said to be predicting a recession.
But what is this indicator and why is it taken so seriously by so many commentators?
Well, in very simple terms, an inverted yield curve describes an unusual occurrence when short-term government bond yields are higher than long-term yields.
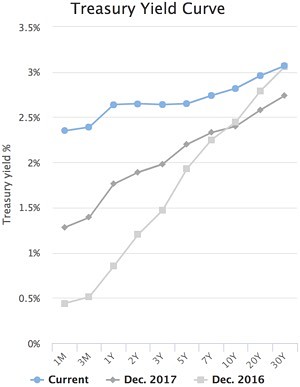
The curve shows the price for a range of interest rate securities, from one month Treasury bills ranging all the way through to 30-year bonds.
The interest rate on these securities generally increases with their time to maturity, which is why the yield curve slopes upwards in most economic environments.
A positive yield curve makes sense because creditors and investors normally want to get a higher return for lending money or buying bonds with longer time horizons.
Over the longer term, that premium compensates investors for a range of potential variables such as growth and inflation, with uncertainty increasing the further out you predict.
So a two year yield is what market participants thinks the Fed will do over that time and a five year yield is what the market thinks it will do over a longer term while a 10 year yield looks all the way through the current cycle of raising interest rates.
So when a yield curve inverts, that is a very unusual market signal and is seen by many analysts as a sign that a recession is on the way.
How can interest rates point to a recession?
But why should the future direction of interest rates be seen as such a strong indicator?
The reason is two-fold: history has shown that in the US, an inverted curve is followed by slowing growth or a recession more often than not.
All of the last nine recessions in the US were predicted by an inverted yield curve and the only false positive – in the mid-1960s – was followed by an economic slowdown rather than a recession.
Secondly, an inverted curve is the product of many thousands of transactions on future interest rates so it is a quite sound indication of where a majority of market participants think rates are going.
If longer dated yields are lower, that indicates that a majority of bond traders think that the US Federal Reserve will be forced to reduce official interest rates in the face of adverse economic conditions.
So what is the yield curve showing?
The US yield curve partly inverted in early December, showing that bond traders are less optimistic about long term growth prospects than the Fed.
Those initial inversions were between the two year and five year and the three year and five year spread.
The two year / ten year spread remained positive but only just, with the flattening cycle pointing to a potential full inversion down the track.
One important thing to note is that an inverted yield curve is not a precursor to an immediate change in Fed policy or an indication that a recession is imminent.
In many cases the Fed has kept hiking rates after the yield curve has inverted and the economy has kept growing.
However, after around 18 months, the recession or slowdown is normally evident, which is why an inverted yield curve is such an important forward indicator.
Does the yield curve work in Australia?
ANZ and others have tried to track the same correlation between an inverted yield curve and recessions or slowdowns in Australia and it turns out the indicator is not a very reliable one here.
Indeed, many Australian yield curve inversions have not been followed by recessions.
The reason for that is primarily about the smaller size of our bond market.
So 10 year Australian bonds tend to be influenced more by the level of 10 year US treasuries than by any considerations about the strength or otherwise of the Australian economy.
The ANZ research did show that yield curve inversions in Australia were still a useful measure for predicting whether growth is likely to accelerate or decelerate in the period ahead.
So, while they did not predict recessions accurately, domestic yield curve inversions did point to slowdowns in economic growth, although there was a lot of variability about the time lag and the extent or duration of any slowdown.
Important not to over-interpret the yield curve
All economic indicators have their faults and despite the accuracy of an inverted yield curve in predicting US recessions in the past, that doesn’t mean it will work again.
That is because all economic data is “live’’ and causes a range of reactions.
The US Fed decision to raise rates also came with a moderation of the number of expected interest rate rises from three to two in 2019.
US Fed Chairman Jerome Powell was careful to stress that the Fed is “data dependant’’ and is going to be watching the figures carefully and adjusting its policy stance accordingly.
It is certainly possible that the Fed will pause the rate rise cycle next year and by doing that it is changing the premise of an earlier yield curve inversion.
The yield curve itself is dynamic and is always changing as circumstances evolve.
Markets, in general, encompass a variety of feedback loops with a full range of geopolitical changes, domestic US politics and the potential for any number of international “black swan’’ events that nobody can predict.
Nevertheless, the US yield curve is one of those indicators that has shown itself to be worth taking note of and preparing accordingly.
Given the hammering that the US and other global share markets have been getting of late, it is quite clear that many investors are doing just that and battening down the hatches for an economic winter storm in the future.