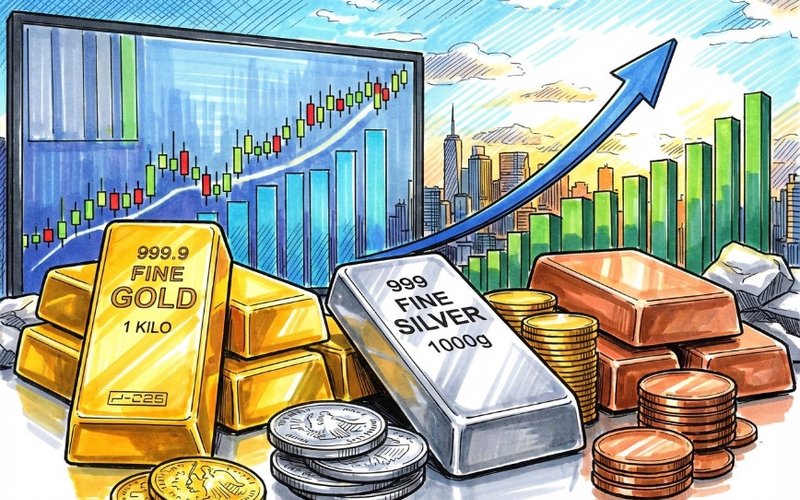

- 01Rally driven by real rates and central-bank demand.
- 02Gold-silver ratio: macro signal.
- 03Outlook 2026-27; selective ASX gold/silver stocks.
Gold and silver have rallied hard enough to invite scepticism. Prices look stretched and near-term consolidation would not surprise. Our view, however, is that the move reflects a deeper repricing rather than speculative excess. Real rates remain supportive, central bank demand continues to absorb supply, and geopolitical fragmentation is now structural. In silver, chronic physical deficits and rising industrial demand add a layer of leverage that past cycles did not fully capture.
In our latest article, we explain why the gold-to-silver ratio remains one of the most revealing diagnostics of monetary stress, how history frames the current compression, and where we see prices heading through 2026–2027. We also outline the ASX-listed gold and silver stocks we believe offer the most compelling risk-reward as this cycle evolves.
* *
*We Offer Wealth Management Services and maintain a selectively positioned portfolio designed to stay ahead of evolving market trends. To learn more about our HIN-Direct Wealth Management Services, please contact me at ++mark.elzayed@investorpulse.com.au++
Despite a powerful rally that has left both gold and silver looking technically stretched, we remain constructive on the precious metals complex. Price action over recent months has been undeniably strong, prompting understandable concerns around near-term consolidation or pullbacks. However, from our perspective, the recent over-extension reflects not speculative excess alone, but a repricing driven by persistent macro forces that remain firmly in place. Real rates, central bank behaviour and geopolitical risk continue to underpin demand, even as positioning indicators flash caution in the short term.
Our bullish stance is therefore not rooted in momentum chasing, but in a structured assessment of fundamentals, flows and valuation. We acknowledge that the path higher is unlikely to be linear, and periods of volatility should be expected after such a sharp advance. That said, we see limited evidence that the core drivers of the rally are close to reversing. Instead, we view any consolidation as part of a broader re-accumulation phase within an ongoing bull cycle, rather than a signal of trend exhaustion.
Why the Gold-to-Silver Ratio Still Matters
We treat the gold-to-silver ratio as a macroeconomic diagnostic rather than a trading statistic. Gold functions primarily as a monetary asset. Central banks are its largest holders, and their accumulation removes supply from circulation for decades at a time. Gold’s price is therefore driven by real interest rates, currency credibility, and sovereign balance sheet risk.
Silver occupies a different role. While it retains monetary characteristics, more than half of annual demand is now industrial. Solar energy, electrification, data centres, and advanced electronics have transformed silver into a strategic input for modern infrastructure. This dual nature introduces volatility that gold lacks.
The critical asymmetry is market size. The investable silver market is roughly eight to nine times smaller than the gold market by value. When investment capital rotates toward silver, price adjustments are abrupt and nonlinear. This is why major compressions in the ratio occur late in precious metals bull cycles, when liquidity is abundant and confidence in fiat money is weakening.
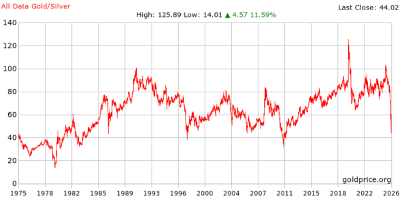
Source: Gold/Silver ratio, goldprice.org (2026) [1]
How Monetary Regimes Reshaped the Gold/Silver Ratio Over Time
Historically, the gold-to-silver ratio was stable only when enforced. Under bimetallic standards, deviations triggered arbitrage that drained one metal from circulation until equilibrium was restored. Once convertibility ended, this stabilising mechanism disappeared. After the collapse of Bretton Woods in 1971, the ratio entered a new statistical regime. Its long-term average widened to roughly 65:1, reflecting decades of disinflation, rising real yields, and gold’s dominance as the primary monetary hedge. However, this average masks violent cyclical behaviour. Each time monetary discipline weakens, or physical silver supply tightens, the ratio compresses sharply toward historical lows. **We view these compressions not as anomalies, but as recalibrations during periods of systemic stress. **
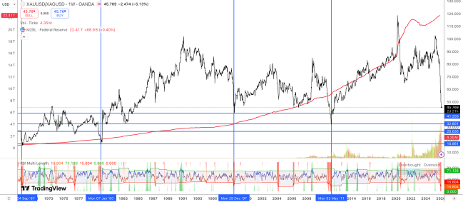
Source: Tradingview, Gold-to-Silver Ratio vs US Monetary Regimes (2026) [2]
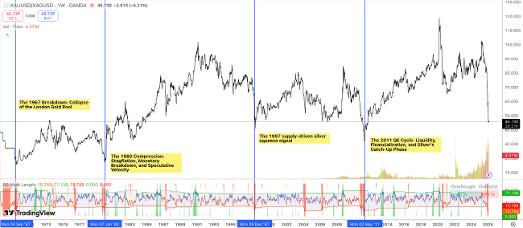
The 1967 Collapse of the London Gold Pool
The 1967 low of 15:1 offers a powerful lesson. At the time, gold was prevented from signalling monetary stress.
The London Gold Pool existed to defend the $35 peg by supplying gold into the market whenever prices rose.
When the UK devalued sterling in November of 1967, confidence in the system cracked. Yet gold prices could not respond freely. Silver could.
Following the removal of silver from US coinage in 1965, silver prices rose nearly 49% in 1967, while gold remained artificially capped.
From our perspective, this episode shows how stress migrates to the least constrained asset. Silver moved first because it was allowed to.
The ratio collapsed because gold was mispriced, not because silver was irrational.
The 1980 Compression
The most extreme modern compression occurred in January 1980, when the ratio briefly reached 17:1.
Inflation exceeded 13%, geopolitical risk was acute, and confidence in fiat currency had eroded deeply.
Silver’s move was magnified by speculative concentration. The Hunt brothers accumulated roughly one-third of global private supply. Silver prices rose more than 700% in under two years, far outpacing gold.
What matters for our current analysis is not just the magnitude, but the velocity. Silver’s smaller market amplified capital inflows, collapsing the ratio rapidly.
The 1997 Signal
The 1997 compression to 41:1 occurred in a low-inflation, strong-dollar environment.
Warren Buffett’s accumulation of 129.7 million ounces of silver exposed persistent physical shortages. Silver lease rates surged above 75%. Prices rose more than 60% while gold stagnated due to central bank selling.
For us, this episode is critical. It demonstrates that ratio compression can occur purely through supply-demand imbalances, without monetary panic. This is directly relevant to 2026.
The 2011 QE Cycle
In 2011, quantitative easing reshaped expectations. Gold led initially, rising toward $1,900.
Silver followed with a delay, then surged as ETFs enabled easy retail participation. The ratio compressed to 32:1 as silver caught up.
As in 1980, margin increases ended the move.
Why M2 Remains Central to Our View
We anchor long-term valuation to money supply growth.
Since 1970, gold prices have shown strong cointegration with US M2. Historically, a 1.0% increase in M2 corresponds to roughly a 0.9% rise in gold prices over time.
With M2 near $22.32 trillion and still growing above 4% year on year, gold above $5,100 does not appear stretched.
Relative to prior monetary expansions, gold remains under-owned.
Velocity is now turning upward as fiscal deficits exceed 7% of GDP and wage pressures lift circulation.
Source: Tradingview, gold/silver ratio (2026 [3]
Why 2026 Is Different
We believe the current cycle combines the strongest elements of all prior ratio compressions. We see geopolitical fragmentation reminiscent of the late Bretton Woods era, fiscal dominance similar to the post-2008 period, and silver shortages that resemble 1997, but on a larger and more persistent scale. The ratio has already fallen from above 80:1 in early 2025 to the mid-40s. Historically, late-cycle compressions tend to overshoot expectations.
Precious metals bull markets typically accelerate into their final phases. In Jan 2026, silver rose nearly 40% in a single month, while gold gained around 15%. Silver is now trading more than 100% above its 200-day moving average, exceeding 2011 extremes. While this signals overextension, history shows that parabolic phases can persist further.
Our Outlook for 2026/2027 Remains Positive
We believe gold has entered a new structural range, with $5,000 acting as a base rather than a ceiling. Forecasts between $5,400 and $6,000 align with our models. Silver offers greater asymmetry. A move to $125 requires modest further compression. A move toward $150 to $180 implies a return to 2011 dynamics. Extreme outcomes above $250 require stress but are no longer mathematically implausible given supply constraints.
From our perspective, the compression of the gold-to-silver ratio is a signal of systemic repricing. Gold anchors monetary confidence. Silver expresses scarcity and leverage. As long as fiscal dominance persists and physical silver deficits remain unresolved, we expect the ratio to continue compressing through 2027, with silver leading and gold providing the foundation. If history is any guide, current prices look less like an end point and more like the midpoint of a structural adjustment that is still unfolding.
The Gold Majors: Stability and Scale
Northern Star Resources: The Sector’s Anchor in an Uncertain Market
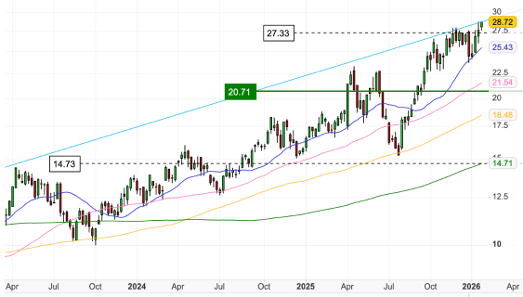
Source: NST, weekly chart (2026)
We continue to view Northern Star Resources (ASX: NST) as the blue chip of the ASX gold sector. The company has again demonstrated its scale and resilience, reporting strong H1 FY26 cash earnings in the range of $1.06 to $1.11 billion. A short-term production disruption caused by a crusher failure at Kalgoorlie was absorbed without material balance sheet stress, with net cash still sitting at around $293 million.
That financial strength underwrites the flagship KCGM mill expansion, which remains on schedule for FY27 commissioning. Once complete, we expect this project to firmly entrench Northern Star as a global top-tier producer, with rising throughput just as gold prices sit near record highs. In our view, the timing could not be more favourable.
From a technical perspective, the share price has shown notable resilience. After a modest pullback earlier in the year, the stock has stabilised above its long-term moving averages, suggesting the market has largely digested the revised FY26 guidance. While Northern Star trades at a premium to some peers, we see this as justified. Its operations are concentrated in low-risk jurisdictions such as Western Australia and Alaska, and its shrinking hedge book maximises exposure to the current gold bull market.
Evolution Mining: Cash Flow Momentum and Balance Sheet Repair
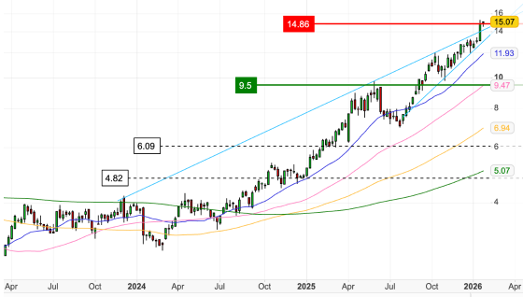
Source: EVN, weekly chart (2026)
Evolution Mining (ASX: EVN) enters 2026 with clear momentum. We note that management has now delivered eight consecutive quarters in line with operational plans, a level of consistency that the market continues to reward. The latest quarterly update was particularly strong, highlighted by a 57% jump in operating cash flow to more than $1 billion.
That cash generation has transformed the balance sheet. Gearing has fallen to just 6%, while cash balances are approaching $1 billion. At the current run rate, we see a credible pathway for Evolution to move into a net-cash position within the year, even as it continues to fund growth at key assets such as Cowal and Ernest Henry.
Technically, the picture remains constructive. The stock is making higher highs, and momentum indicators such as the RSI point to sustained buying interest rather than exhaustion. Valuation screens suggest the shares are approaching full value after a rally of more than 40%, but we would caution against relying solely on traditional multiples. At current gold and copper prices, the volume of free cash flow being generated provides a margin of safety that headline P/E ratios are likely understating.
Ramelius Resources: Capital Discipline Meets High-Grade Growth
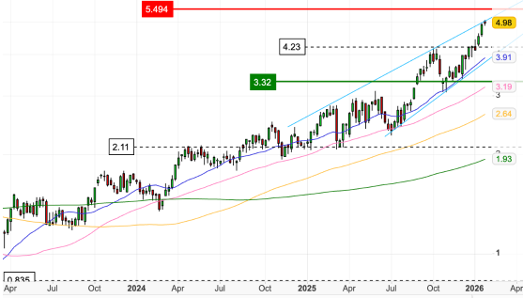
Source: RMS, weekly chart (2026)
We see Ramelius Resources (ASX: RMS) as one of the most disciplined and efficient mid-tier producers in the sector. The company has reaffirmed its FY26 guidance and continues to progress its Five-Year Gold Production Outlook, targeting 500,000 ounces by FY30. Crucially, it is doing so from a position of balance sheet strength.
Cash and gold on hand total roughly $694 million, giving management the confidence to launch a $250 million share buyback. In our view, this is a clear signal of capital discipline and confidence in underlying asset quality. Combined with the development of the high-grade Never Never deposit at Dalgaranga, Ramelius stands out as a rare blend of growth and yield.
From a market perspective, the stock has been a standout performer, outperforming the ASX 200 by close to 100% over the past year. The current consolidation phase is technically constructive and is often interpreted as a bull flag rather than a loss of momentum. Valuation also remains compelling, particularly when set against all-in sustaining costs that are among the lowest in the sector, translating into substantial margins at current gold prices.
The Silver Contenders: High-Leverage Growth
Silver Mines: Permitting Risk, Price Leverage
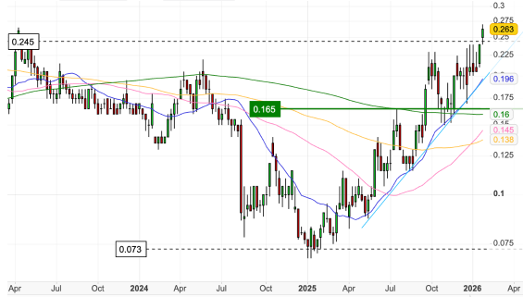
Source: SVL, weekly chart (2026)
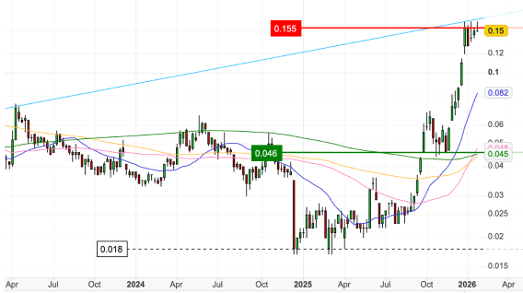
For investors seeking pure-play silver exposure, we see Silver Mines (ASX: SVL) as the primary ASX-listed vehicle. The company’s focus remains firmly on the Bowdens Silver Project, the largest undeveloped silver deposit in Australia. As of early 2026, attention is centred on refreshed ecological surveys and the final stages of the project’s Development Application re-determination.
The backdrop has shifted meaningfully in Silver Mines’ favour. With silver prices up more than 16% recently and now above $84/oz, the project economics have moved from robust to exceptional. In our assessment, this materially lifts the potential net present value of Bowdens relative to earlier studies.
The stock remains a high-beta expression of silver prices and tends to move sharply with the underlying commodity. It is currently testing key resistance levels, and a decisive break would likely trigger a broader re-rating as investors look ahead to the anticipated mid-2026 submission of the updated biodiversity assessment. While the company remains pre-revenue, the market capitalisation continues to sit at a steep discount to the in-situ value of its silver resource, offering substantial upside if permitting risks are resolved.
Investigator Silver: A High-Grade Developer Approaching Inflection
Source: IVR, weekly chart (2026)
Recently rebranded to reflect its singular focus, Investigator Silver (ASX: IVR) is moving rapidly toward a definitive feasibility study at the Paris Silver Project, expected in the first half of 2026. Operational progress has been encouraging, with recent optimisation work delivering a 6% improvement in silver recovery. The balance sheet has also been strengthened by a $10 million institutional placement.
Located in South Australia, Paris is one of the highest-grade undeveloped silver assets in the country, with a resource of 57 million ounces. We view the asset quality as underappreciated, particularly in the context of the current silver price environment.
The technical chart supports this view. A rounding bottom formation suggests a transition from prolonged accumulation to a new uptrend. Fundamentally, the leverage to silver prices is striking. Company sensitivity analysis indicates that incremental increases in the silver price translate into disproportionately higher free cash flow. At current spot prices, we believe Investigator Silver is one of the most undervalued silver developers on the ASX when assessed against its projected margins and development trajectory.
If you enjoyed reading my article, you can reach out to me at ++mark.elzayed@investorpulse.com.au,++ add me on LinkedIn and subscribe to my research. I look forward to connecting with you.
Get the wire before the market opens.
The ASX small-cap stories that matter, filed before 9am AEST. Curated by the Small Caps desk.